User tracking is becoming obsolete, but this strategy could be the fix
Over the past two years, uncovering insights about buyers and markets has become increasingly difficult. In response, we've invented new methodologies to discover hidden truths about markets and people.
Tell me your home address and I can tell you how much money you make, whether you graduated college, and who you voted for in the last election.
Or at least, I can make a pretty good guess.
In business strategy and digital marketing, demographics are everything. They help us refine and narrow our audience to those who are most likely to resonate with the message we are trying to get out. Historically, targeting digital ads to specific groups has been pretty straightforward. You’d punch in some parameters around age, income, interests, and gender, launch your campaign, and watch the algorithms go to work.
But in the past year, understanding and optimizing for consumer demographics has become increasingly difficult with the implementation of Apple’s App Tracking Transparency on iOS. In response, our team of data scientists has been experimenting with new ways to make inferences about customers, not just in digital marketing, but also in our digital product and consulting engagements.
We soon found that user location is one of our most reliable demographic indicators.
This is because much of the US is sadly still very segregated. Your neighborhood is likely very distinct in many demographic traits – not only in terms of race and ethnicity, but also political affiliation, education, income, and even marital status.
This geographic division has clear negative impacts. However, we’ve recently had the privilege of working on many projects with nonprofit groups and government agencies where geodemographic research and targeting has helped provide social services and economic benefits to disadvantaged groups.
Find Your Neighborhood
Want to see the demographics of your neighborhood? Each year, the US Census Bureau publishes the American Community Survey, featuring over 20,000 unique demographic variables for districts across the country. While many of these variables are expected (age, gender, number of children), some are highly specific, such as:
- Percent of population with Polish ancestry
- Commuters who walk to work
- Foreign born population, excluding population born at sea, from Oceania
- Population enrolled in Kindergarten
- Rental vacancy rate
- Population employed in transportation/warehousing/utilities industries
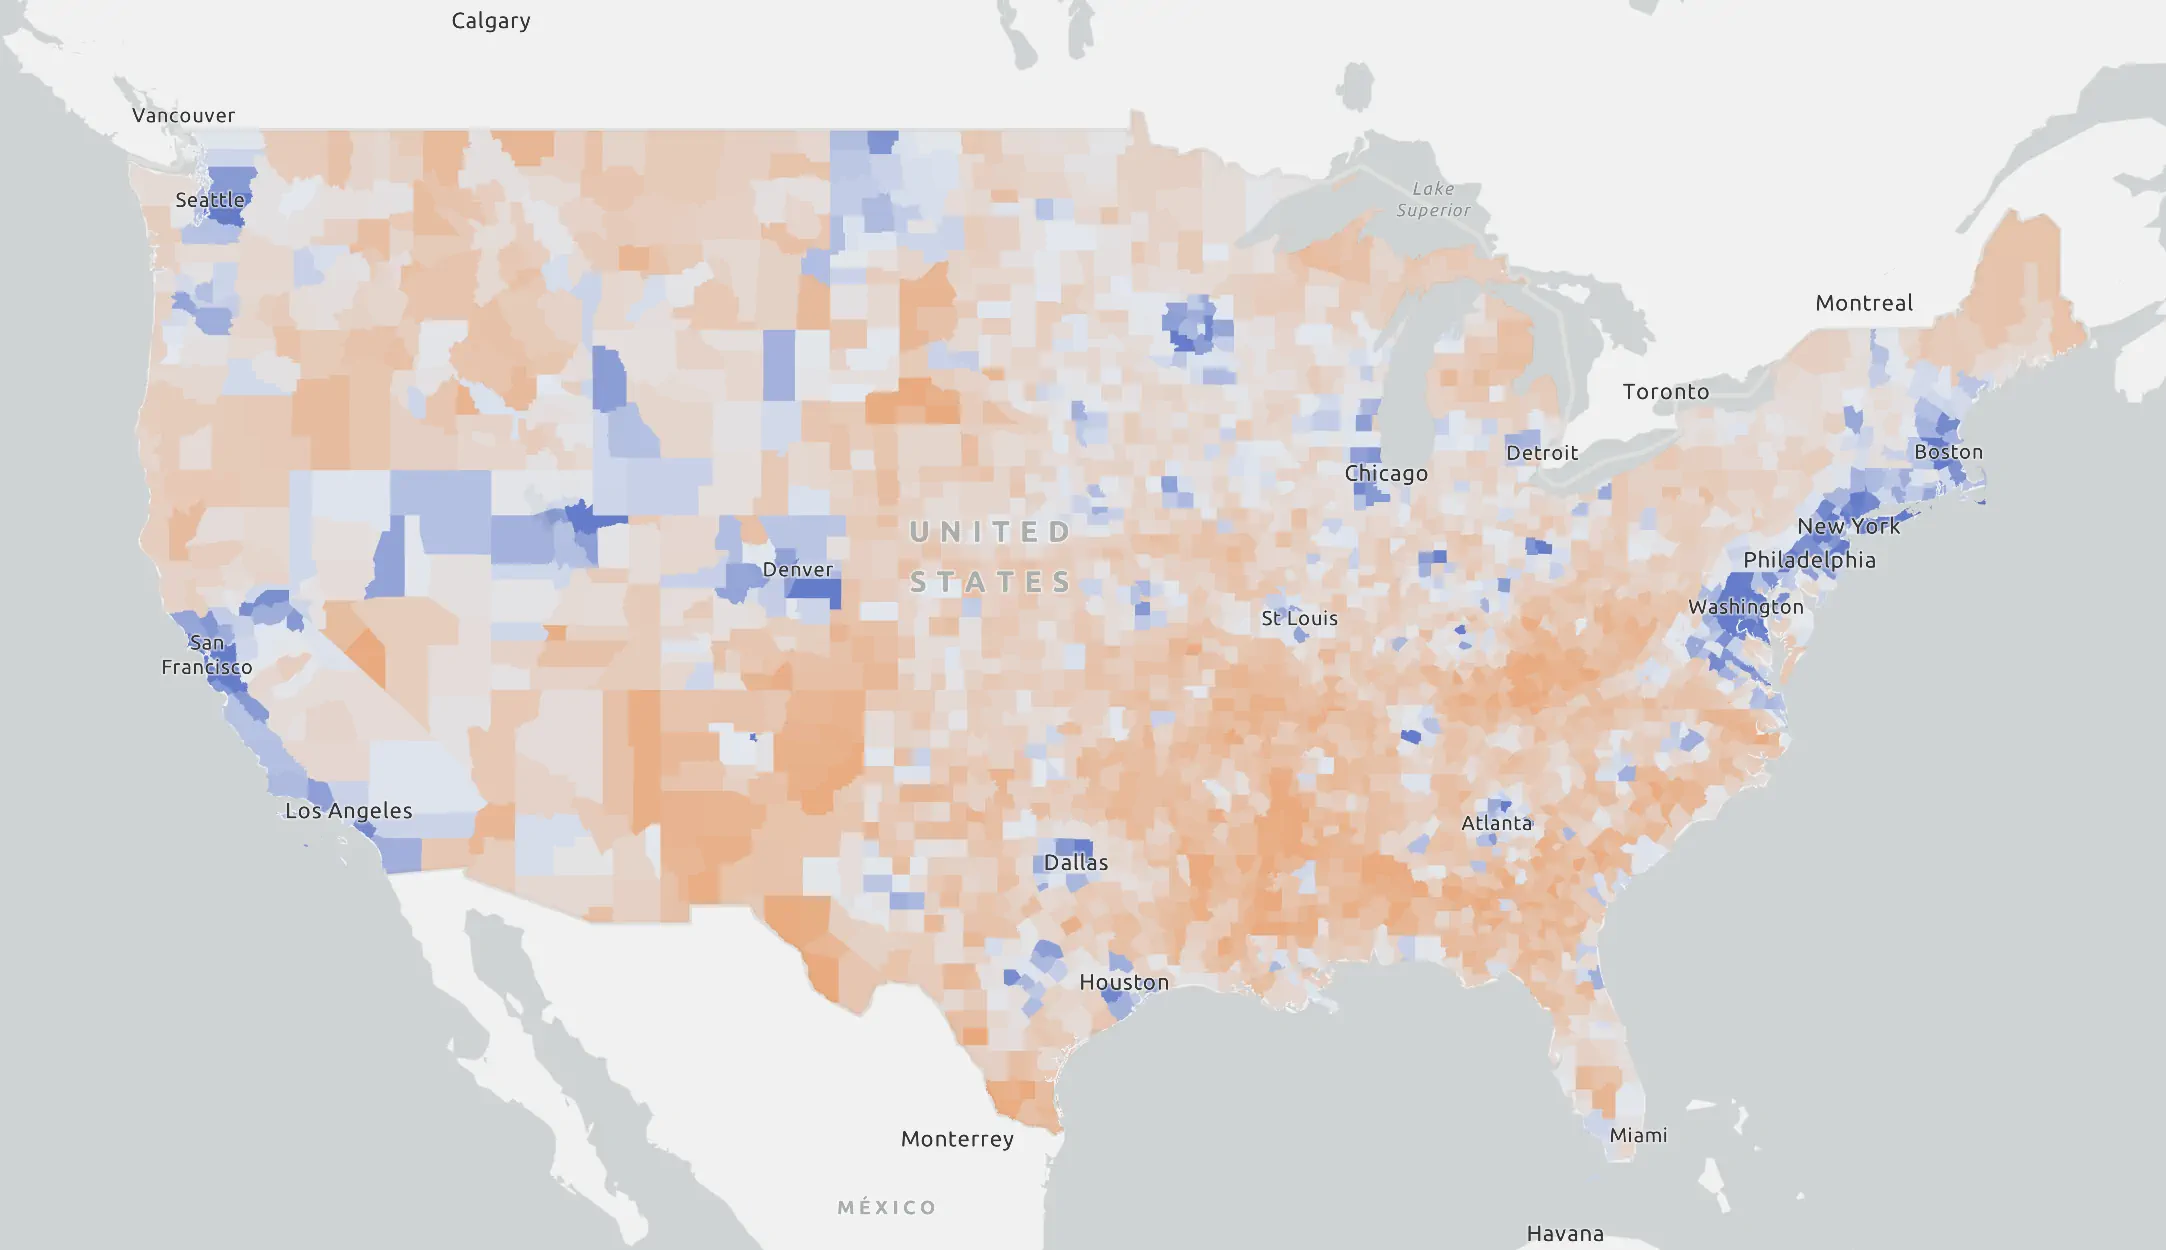
Maps like this one we made, displaying median household income, show how many of these variables differ dramatically, even when compared a few miles apart.
For example, the maps below from the San Francisco Bay Area shows differences between communities such as Oakland, Berkeley, and the tech-dominated downtown SF.
Notably, these differences are apparent even in neighborhoods separated by a few blocks. The median household in the Pacific Heights district, for example, brings in an annual income of nearly a quarter million dollars. By contrast, just blocks away, households in the historic Western Addition typically earn just one-tenth the income.
Similarly, the median age in the Western Addition is about 20 years older. And perhaps most shockingly, monthly rent is just half the price of neighborhoods a mile north, thanks largely to HUD subsidies and rent control policies.
Promoting Social Services through Geotargeting
Late last year, Meta and other social media platforms announced that they would be removing advertisers’ ability to target ads based on sensitive factors such as a person’s race, religion, and political affiliation.
This was an admirable move. In many cases, social media advertising had become a key factor in foreign election interference, political extremism, pervasive racism, and discrimination in finance, housing, and employment.
However, for some nonprofits, government agencies, and other organizations, the targeting changes posed a serious challenge. While these organizations could previously promote their services to disadvantaged individuals, they would now be restricted in their access to communities who needed help the most.
Hypothetically, a nonprofit legal aid group offering help to migrants would be limited in its ability to connect with potential clients. A college seeking to increase its visibility among prospective students of color would struggle to market to diverse audiences.
Earlier this year, Gitwit’s campaign team was posed with a similar targeting problem. Our client, a community organization offering financial counseling to low-income working families, needed to promote its services to its target audience.
Although many ad platforms still allow income-based targeting, the options are nearly always limited to high income groups (e.g., “Top 10% of US households”). While those targeting options might be helpful for an ecommerce campaign, our client’s mission required us to get more creative.
Given that the American Community Survey offers hundreds of economic and demographic variables by zip code, we dove into the data. We identified a variety of factors likely to indicate eligibility for our client’s services, such as SNAP (food stamps) eligibility, unemployment rate, and percent of single parent households. Then, we selected zip codes matching those indicators.
After running ads to our chosen zip codes for two months, we aggregated ad engagement data and plotted correlations against each zip code’s demographic data.
The correlations gave us rich insights into who engaged with our ads. Among the top engagers were many groups we expected:
- People with less than a 9th grade education
- Uninsured people
- Construction, maintenance, service, and retail workers
And among the lowest engagers:
- People with a graduate degree
- Two-parent households
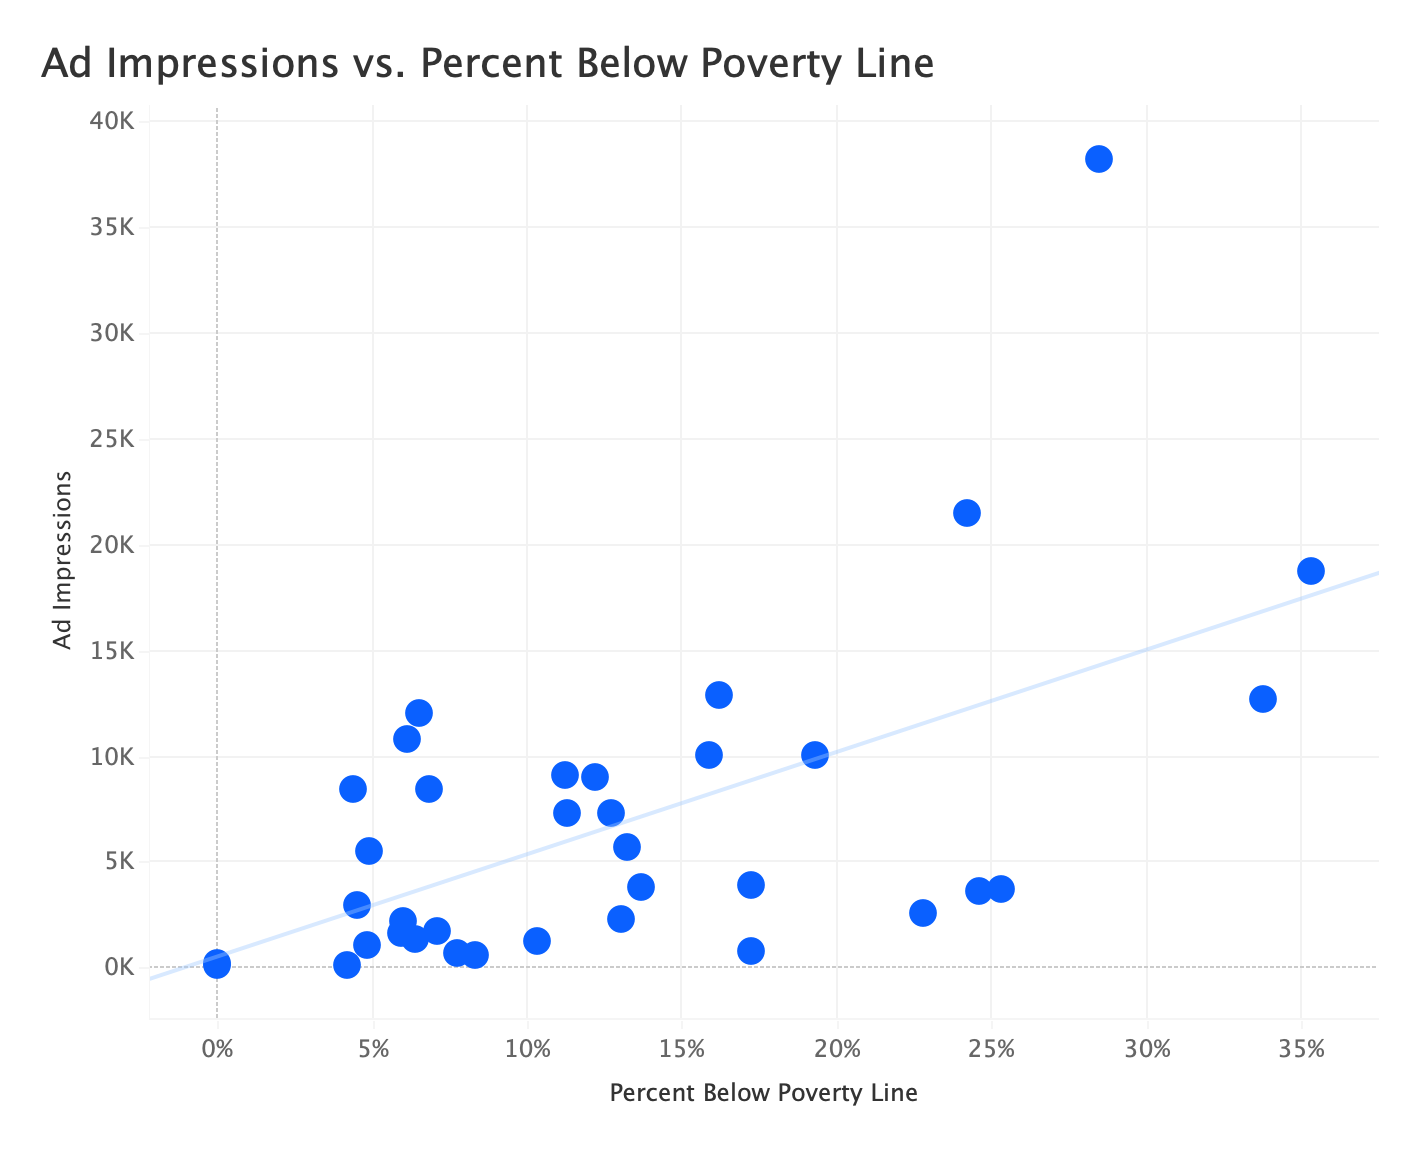
Conversely, the correlation between the population working in management/business/science jobs vs. ad impressions was negative (R2 = -.408), suggesting we were much less likely to serve ads to people with careers in those industries.
We also encountered a few unexpected results. Notably, our ads underperformed with Native American audiences when compared to other groups. Our targeting methodology had disproportionately focused on urban zip codes, while greater proportions of Native Americans live in rural zip codes. As a result, we increased budgets in some strategic zip codes in the later months of our campaign to create more equitable reach.
Our geographic insights also helped our client optimize their operations. For example, after seeing that working single parents were disproportionately seeking help, they explored ways to offer services at times that wouldn’t conflict with common work and school schedules.
Understanding Child Care Deserts
Many Americans are aware of the concept of food deserts, that is, pockets of the country with no nearby grocery store providing access to fresh, healthful food.
A similar concept has emerged around access to child care. According to the Center for American Progress, around half of Americans live in so-called child care deserts – areas with too few licensed child care facilities to meet the community’s needs.
Parents in these areas are often posed with difficult trade-offs between maintaining a job or staying home with kids, potentially holding back economic advancement for families and communities.
The issue is particularly acute for families in rural areas, where 3 of every 5 communities are considered child care deserts.
In Oklahoma, where more than 60% of the population lives in rural areas, state agencies have been seeking to understand this problem more deeply. Among the questions that have emerged are:
- Which cities and towns have the greatest deficit in child care capacity?
- Are any specific demographic groups more likely to be impacted?
- Does the quality of existing child care facilities vary geographically?
For one of our clients offering support to Oklahoma families and child care providers, answering these questions would be a key step in identifying how to best allocate their resources across the state.
Given that the landscape has changed dramatically since prior to the Covid-19 pandemic, existing pre-pandemic data wouldn’t suffice. Instead, Gitwit’s researchers began aggregating the most up-to-date information possible to create a new fine-scale map of 2022 child care deserts in Oklahoma.
Using CAP’s methodology as a framework, we began by producing a complete list of current child care facilities, with their associated capacities and quality ratings, from OKDHS’s child care locator tool.
From there, we obtained demographic data from the US Census to identify how many children under the age of 5 live in each Oklahoma zip code. Then, we merged our datasets to calculate the ratio of children under age 5 to the cumulative child care capacity. By CAP’s definition, a ratio greater than 3 qualified as a child care desert.
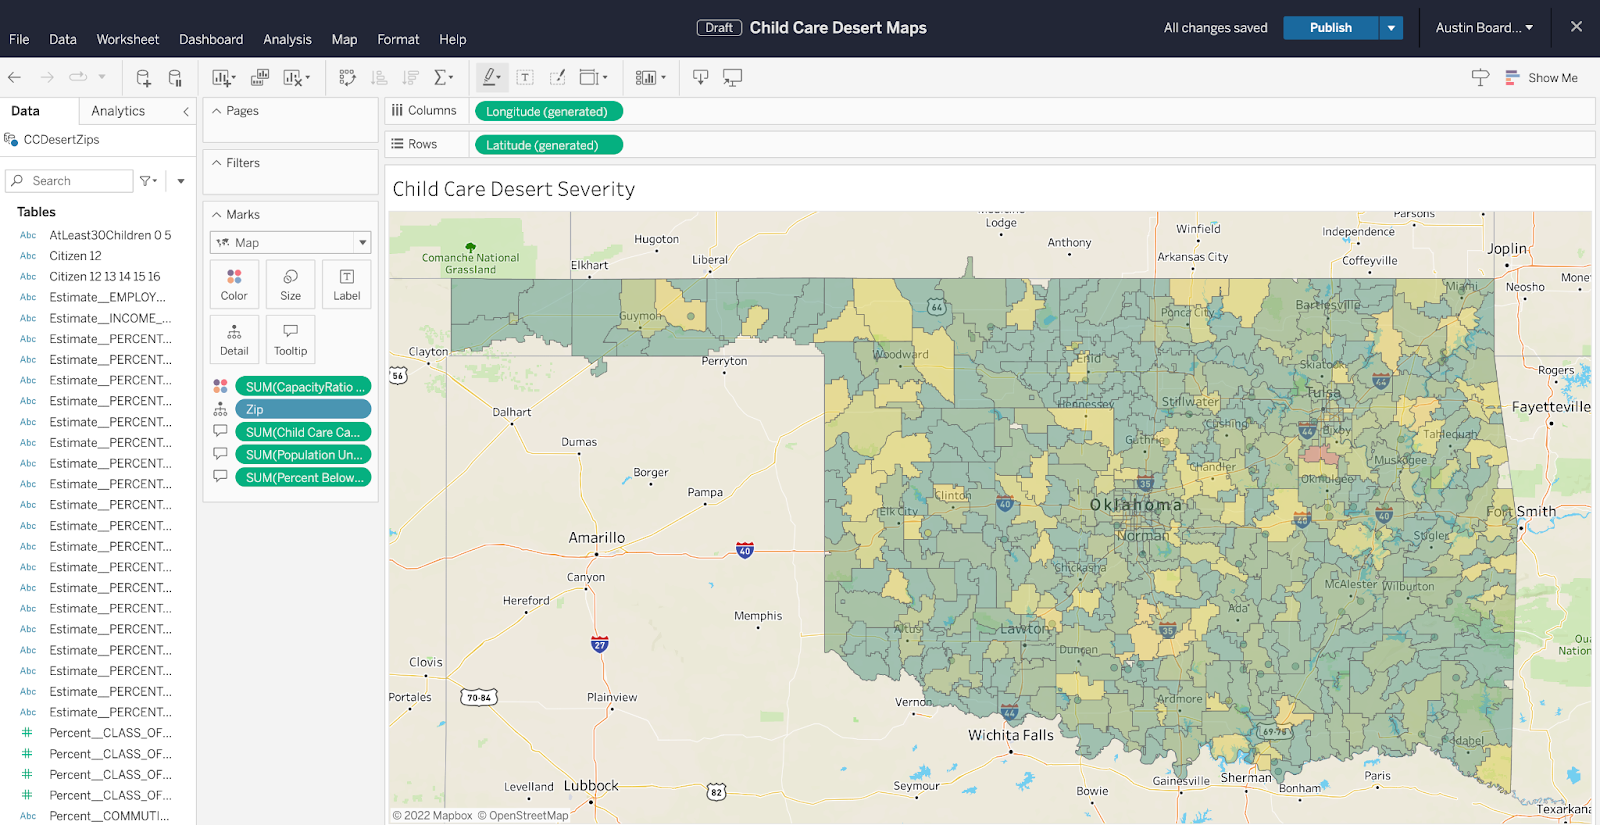
Because our client would be dynamically leveraging our dataset to make strategic decisions, we created interactive maps in Tableau to facilitate exploratory data analysis. For example, users could filter child care capacity according to the quality of facilities, allowing teams to answer questions as they arose and explore new, better questions to investigate on the fly.
How can my organization leverage geodemography?
Despite an abundance of CEOs striving to make their organizations more data driven in recent years, most say they haven’t made enough progress.
In many cases, the issue isn’t an inadequate amount of data. Modern enterprise is drowning in numbers. Rather, the underlying problem is often a lack of context needed to generate meaningful insights.
Luckily, much of the context needed to answer many common questions can be obtained from free data sources, and can be extracted based on location. Rich demographic insights available through the US Census Bureau and other publicly available sources can be crucial in helping to inform even the most complex business decisions.
Interested in learning more? Our Insights & Consulting group would love to chat. No need to have a solution in mind. Just bring us a problem – it’s our favorite place to start.